One of the things I like to track year over year is how good each of baseball's divisions are. Given the unbalanced schedule, divisional strength plays a fairly large role in overall records and it can be challenging to compare teams across divisions. I think that looking at overall divisional quality helps us better understand how good teams really are.
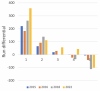
The simple metric that I like to use to understand divisional quality is aggregate divisional run differential. If you add up the total run differential of each division, the result will give you the division's overall performance against non-divisional opponents as in-division games automatically wash out in terms of run differential.
Currently, the 2022 AL East is on pace to set a high water mark for divisional quality by this metric. If the division keeps playing at the current rate, they will finish with a run differential in the mid 400's. I can't recall ever seeing a number like this before, so I went through the data for each year since the divisional re-alignment (except for 2020). Here is what I found:
So currently the AL East is on pace to exceed the #1 division since 2012 by approximately 50%. That is wild. The only result on the list that is even as close to extreme is the last place 2018 AL Central with it's -420 differential.
I wish I had a better grasp of how to use this information to handicap team performance, but sadly I don't. I am going to take another dive in and look to see how playoff performance might align to divisional quality.
Here are how the divisions rank in the post 2012 period (again, not counting 2020):
Strangely, it seems that, despite the unbalanced schedule, over this span divisional quality hasn't suppressed post-season appearances. The AL East has taken 9 Wild Card slots to the AL West's 4 and AL Central's 3.
It also hasn't seemed to impact post-season success that much. Over the span the AL East is 18-14 in postseason series, the AL Central is 9-10 and the AL West is 9-9. A lot of the difference comes from Wild Card games, in which the AL East is 6-3. Looking only at divisional series and beyond the AL East is 12-11, the AL Central and West are both 8-8. Interestingly the AL Central's success is almost entirely due to the 2014-15 Royals and the AL West's success rests heavily on the 2017-2021 Astros, while the AL East is represented by basically every team with only the Rays lacking any deep runs.
I'm not really sure what to make of all of this and would love to hear your thoughts.
The simple metric that I like to use to understand divisional quality is aggregate divisional run differential. If you add up the total run differential of each division, the result will give you the division's overall performance against non-divisional opponents as in-division games automatically wash out in terms of run differential.
Currently, the 2022 AL East is on pace to set a high water mark for divisional quality by this metric. If the division keeps playing at the current rate, they will finish with a run differential in the mid 400's. I can't recall ever seeing a number like this before, so I went through the data for each year since the divisional re-alignment (except for 2020). Here is what I found:
- 2015 AL East (304)
- 2018 AL West (256)
- 2016 AL East (243)
- 2021 NL West (229)
- 2013 AL East (222)
- 2013 NL West (219)
- 2021 AL East (214)
- 2018 NL West (155)
- 2014 NL West (150)
- 2019 AL West (143)
- 2017 AL East (116)
- 2015 NL Central (108)
- 2019 NL East (102)
- 2016 NL Central (90)
- 2018 AL East (88)
- 2017 AL West (71)
- 2017 NL West (61)
- 2019 NL Central (39)
- 2017 NL Central (39)
- 2018 NL Central (32)
- 2019 AL East (36)
- 2014 AL East (24)
- 2014 NL East (21)
- 2019 NL West (18)
- 2015 AL West (10)
- 2013 AL Central (3)
- 2016 AL West (-26)
- 2015 NL West (-40)
- 2014 NL Central (-50)
- 2021 AL West (-61)
- 2014 Al Central (-65)
- 2016 NL West (-66)
- 2014 NL West (-80)
- 2017 AL Central (-81)
- 2021 NL East (-83)
- 2015 AL Central (-85)
- 2016 AL Central (-103)
- 2018 NL East (-111)
- 2021 AL Central (-116)
- 2013 AL West (-136)
- 2016 NL East (-138)
- 2013 NL Central (-141)
- 2013 NL East (-167)
- 2021 NL Central (-183)
- 2017 NL East (-206)
- 2015 NL East (-297)
- 2019 AL Central (-338)
- 2018 AL Central (-420)
So currently the AL East is on pace to exceed the #1 division since 2012 by approximately 50%. That is wild. The only result on the list that is even as close to extreme is the last place 2018 AL Central with it's -420 differential.
I wish I had a better grasp of how to use this information to handicap team performance, but sadly I don't. I am going to take another dive in and look to see how playoff performance might align to divisional quality.
Here are how the divisions rank in the post 2012 period (again, not counting 2020):
- AL East: 1247
- NL West 496
- AL West: 407
- NL Central: -66
- NL East -879
- AL Central: -1205
Strangely, it seems that, despite the unbalanced schedule, over this span divisional quality hasn't suppressed post-season appearances. The AL East has taken 9 Wild Card slots to the AL West's 4 and AL Central's 3.
It also hasn't seemed to impact post-season success that much. Over the span the AL East is 18-14 in postseason series, the AL Central is 9-10 and the AL West is 9-9. A lot of the difference comes from Wild Card games, in which the AL East is 6-3. Looking only at divisional series and beyond the AL East is 12-11, the AL Central and West are both 8-8. Interestingly the AL Central's success is almost entirely due to the 2014-15 Royals and the AL West's success rests heavily on the 2017-2021 Astros, while the AL East is represented by basically every team with only the Rays lacking any deep runs.
I'm not really sure what to make of all of this and would love to hear your thoughts.
")