As I've alluded to elsewhere, and as I've referenced on Twitter in this thread, I've been working on a project to generate NBA box score projections. This is by orders of magnitude the most significant private NBA project I've worked on. As the season is upon us, I wanted to post here to let people know about what these are, a bit about how they work, and their strengths/weaknesses.
Essentially, I have attempted to create to something resembling Steamer/PECOTA/ZiPS for the NBA. This was driven by the fact that similar projection models don't seem to exist in the public domain for the NBA, despite the existence of fantasy basketball (while there are products like Basketball Monster, those are "hand curated" projections). Some features of the model:
The model accounts for such seasonality, and likewise accounts for the small dip you see there in 2pt FG% about two thirds of the way through the year (which coincides with the all-star break). This is done on a component by component level, with different effects modeled for each component.
I think that describes the bulk of what I've done here. A cut of the projections for opening night games (literally just 4 games) can be found here: View: https://docs.google.com/spreadsheets/d/1mhwOLqPu2F9026EQiVxFPIN1t9RGafGpl-dokaIsm9c/edit#gid=0
This will be expanded, hopefully by tomorrow, to include:
I am also working to generate team-win projections using this data, which I know some of you had asked for. It's coming I promise, but it may end up being a Tuesday afternoon thing unfortunately.
This project is very much a work-in-progress, and will be updated throughout the season, so you may see big changes in some players' projections in response to model changes, as opposed to new data. I'd bet you'll also see some bugs, and obvious errors, and I'm working hard to correct those, but given the scope of this project, it's inevitable you'll find some of them. Please feel free to DM me here, or on Twitter to alert me to any errors. I may at some point built out a better front-end for this than Google Sheets, but I have zero expertise in something like that, so it'd be a ways away.
Enjoy!
Essentially, I have attempted to create to something resembling Steamer/PECOTA/ZiPS for the NBA. This was driven by the fact that similar projection models don't seem to exist in the public domain for the NBA, despite the existence of fantasy basketball (while there are products like Basketball Monster, those are "hand curated" projections). Some features of the model:
- Daily Updating and Recency Weighting. This is really the core advance of the model. In addition to creating a preseason projection for each player (e.g., something which tells you that Kawhi Leonard is projected for a 45.7% FG% this year), the model I've built constantly updates in response to new information, weighting more recent performance more heavily. This applies both to new games this year, but also for games for prior seasons, dealing with the issue of "Player X struggled overall last year, but closed the year extremely strong". In principle, that closing-the-year-strong is accounted for in this model. I do this without any arbitrary endpoints of looking at the last X games. Every game a player has ever played is part of their projection. This accounts for spotting "breakouts" and declines, and updating projections to account for new data on a day-by-day level.
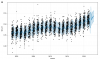
- Seasonality. Offensive efficiency to start the season is extremely low, and increases throughout the year. This applies to essentially every element of offense. Turnovers are high. Shooting percentages are low. Assist rates are low. Here's a chart of 2pt FG over the last 19 years, with the black dots being observations, and the blue line being the trend. As you can see, within each season, the trend is for 2pt FG% to rise:
The model accounts for such seasonality, and likewise accounts for the small dip you see there in 2pt FG% about two thirds of the way through the year (which coincides with the all-star break). This is done on a component by component level, with different effects modeled for each component.
- Rest/travel/home court effects. This is mostly what it sounds like, and the model accounts for these effects, again on a component by component level. On a technical level, I have gone to great lengths not to overfit these effects, and the projections include projected rest/travel/home court effects, themselves accounting for recency, and changes in the league environment (home court for instance is decreasing overall).
- Opponent Adjustments. This is similar to the above - I have adjusted these projections for who each team is playing on a given night, accounting for the projected defensive strength of that team's influence on every individual component. This aspect is done at a team-level only for now, although I will move this to a position-level adjustment in time (e.g., the Celtics defend opposing guards with different effectiveness than opposing bigs).
- Tracking data. Similar to 538's debut of RAPTOR, these projections account for some of the next-gen tracking data available from stats.nba.com. That means that something like a player's average speed, or their hustle stats affect their projections. This data mostly does not have a big impact on box-score projections, although I am continuing to do further work here. This is a major aspect of future improvement to the model.
- Interaction Effects. The model accounts for the interaction between various box-score components, so if a player improves their free throw shooting, their projected three point shooting will likewise also improve. The same goes for interactions between other stats.
- Free Agency. The model regresses players to the mean when they change teams. Changing teams has a big impact on some box-score components, and the model accounts for that. It also gets less confident in a player's overall projection in response to changing teams - meaning the model will update more quickly in response to new data after a player has changed teams.
- Preseason and Summer League Data (Coming Soon). This is actually not yet in the model, but I wanted to call it out as I may yet be able to get it in there in a week or so. Right now, every rookie has the same base projection (with slight age differences). In order to address that, I'm going to be adding preseason and summer league data to their projections. This data will impact different players differently, and should help address the issue of Zion having roughly the same projection as Romeo right now. As this is not yet included however, this is currently a major weakness of the model right now (all rookies have functionally a replacement level projection). I may in time also add NCAA and foreign data, but that's a massive undertaking and is a 2020-2021 project at best.
- Minutes. I project minutes per game for each player, in a similar approach to everything else. However, these projections predictably end up being pretty rough, as it's very difficult to project PT just from past data. These projections are provided, but there is no "hand adjustment", so make of this what you will. Feel free to update the minutes projections as you like and adjust the, stats up/down as necessary. For example, right now I have Anthony Davis projected to playing only 28.3 minutes a game, as he changed teams, and barely played down the stretch last year. As he plays more minutes, the model will rapidly update him to the mid 30s of course, but I wanted to call out this caveat. I've put in a lot of work on the minutes, but I'm pretty sure someone doing this by hand could improve on them.
I think that describes the bulk of what I've done here. A cut of the projections for opening night games (literally just 4 games) can be found here: View: https://docs.google.com/spreadsheets/d/1mhwOLqPu2F9026EQiVxFPIN1t9RGafGpl-dokaIsm9c/edit#gid=0
This will be expanded, hopefully by tomorrow, to include:
- Base level projections for each player.
- Daily projections for each player for each day of the season.
I am also working to generate team-win projections using this data, which I know some of you had asked for. It's coming I promise, but it may end up being a Tuesday afternoon thing unfortunately.
This project is very much a work-in-progress, and will be updated throughout the season, so you may see big changes in some players' projections in response to model changes, as opposed to new data. I'd bet you'll also see some bugs, and obvious errors, and I'm working hard to correct those, but given the scope of this project, it's inevitable you'll find some of them. Please feel free to DM me here, or on Twitter to alert me to any errors. I may at some point built out a better front-end for this than Google Sheets, but I have zero expertise in something like that, so it'd be a ways away.
Enjoy!