The strike zone in 2014 and onward

Status
Not open for further replies.

iayork

Member
SoSH Member
Apr 6, 2006
639
Farrell has said that the strike zone is larger this year, and blames that for the lower offense.

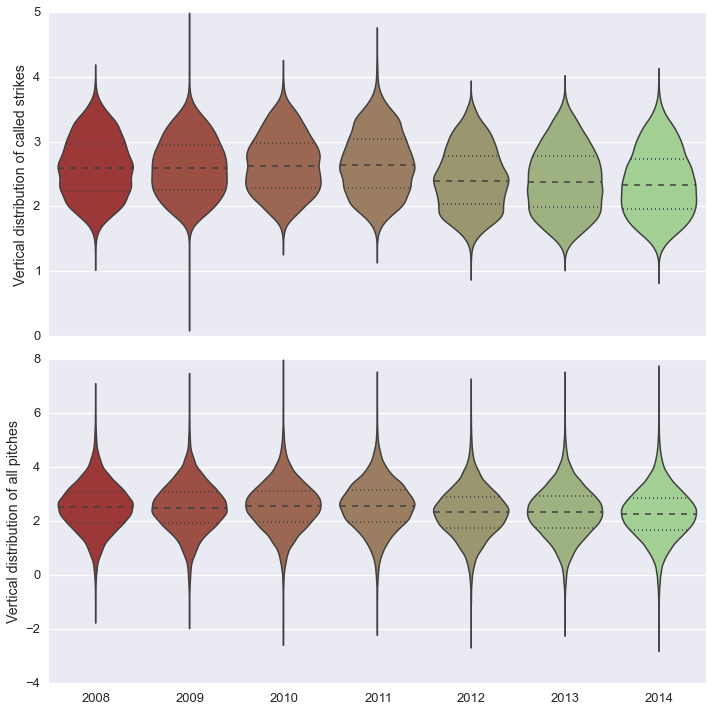
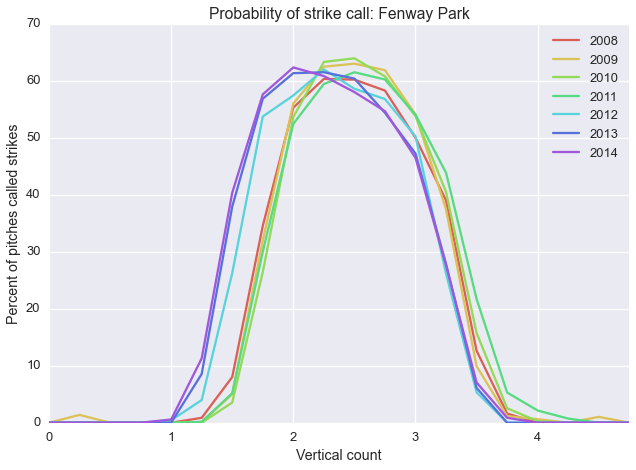
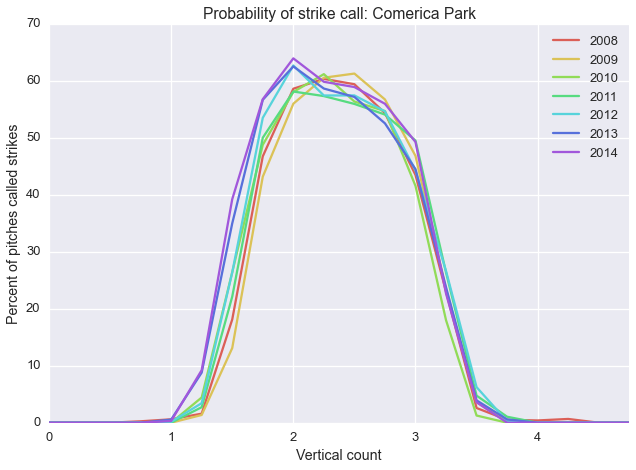
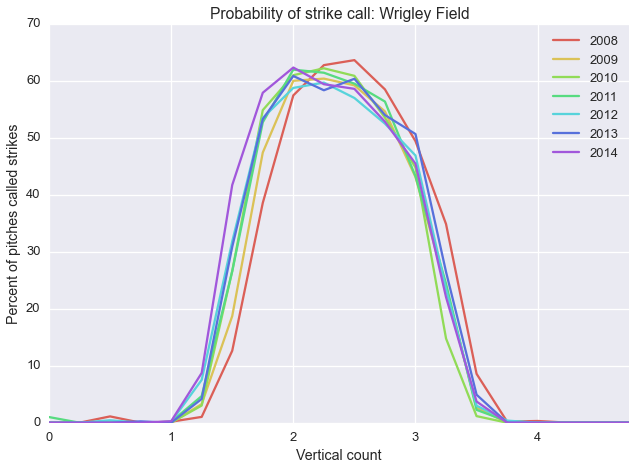
This article in The Atlantic, "The Simple Technology That Accidentally Ruined Baseball", argues that the strike zone is getting larger because of Pitch F/x, and especially has expanded at the bottom of the zone. It illustrates its case with images like this:

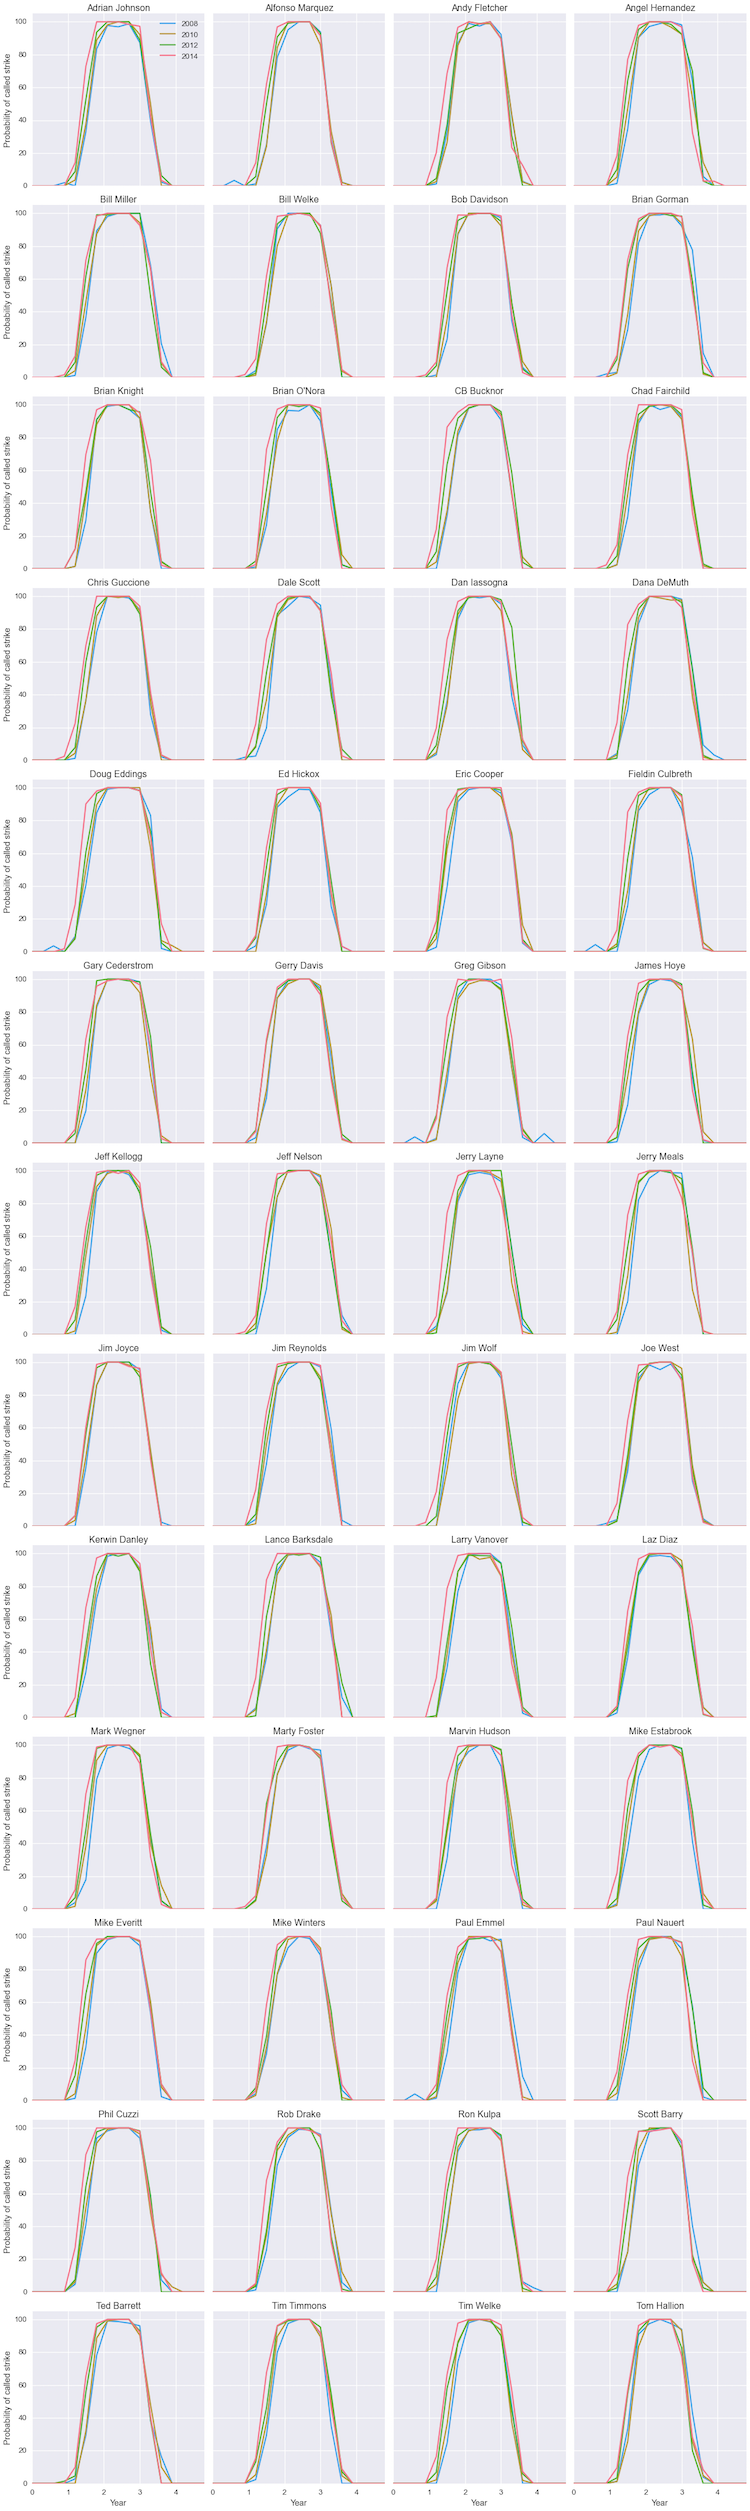
On The Hardball Times, "The Strike Zone During the PITCHf/x Era" says the same thing, with images like this:

My questions:
Is the minor-league strike zone similarly changing? It seems unlikely, if Pitch/Fx is truly the driver for the change.
Could this be why our minor-leaguers (JBJ, Xander, WMB) are having so much more trouble in the majors this year?
Is this likely to be more of an issue with teams who have emphasized a grinding, pitch-taking approach through their organization?
 

Mighty Joe Young

The North remembers
SoSH Member
Sep 14, 2002
8,467
Halifax, Nova Scotia , Canada
Well .. It seems this has been a gradual change over the last 7 years .. As to whether PitchFX is the driver here remains to be seen. It could simply be that Umps have been encouraged to call more low strikes - or that newer umps are more inclined to call the low strike.

As to the affect on rookies .. As mentioned this is a trend .. Not a sudden development. One would think that it would have affected rookies last year and the year before that as well. If, there truly is a difference in strike zones between AAA and the majors.

Lot of variables here and it will be difficult to truly isolate the cause. Not that it matters really. Hitters are simply going to have to adjust.
 

iayork

Member
SoSH Member
Apr 6, 2006
639
One problem with the notion that the larger strike zone is responsible for all our woes is the fact that while offense is way down from its steroid-fueled peak, OPS is really only back to the pre-steroid-era level. OPS over time:

Dead-ball era in green, WWII in red, "the year of the pitcher" and a couple years before it in blue, the approximate steroid era in grey.
 
But that's a little deceptive, because SLG hasn't dropped nearly as much as OBP.  OBP is at a 30-year low.  I think that's what you'd expect with an expanded strike zone; hits will go as far as ever, but there will be fewer of them.
 
Again, is this something that would disproportionately harm a team like the Sox that has emphasized OBP?
 
As to why we haven't seen rookies struggling with this before -- This is really the first year we'd have a chance to see it, isn't it?  Since the advent of Pitch f/x through 2013 the only two rookies I think of who have played significant time for the Sox are Middlebrooks and Nava.  Nava came up in 2010, so he's probably had a chance to watch the zone change year by year.  Middlebrooks ... is not a poster child for resilient rookies.  
 

iayork

Member
SoSH Member
Apr 6, 2006
639
Well, that's my point, or at least my question. The minors don't have pitch f/x. Do they have "the old zone"? I assume they do, so rookies are being moved literally overnight from one strike zone to another that's much larger. By comparison, major leaguers have seen a gradual year-by-year change that they can consciously or unconsciously adapt to. Hence, more of a problem for rookies.
 

Mighty Joe Young

The North remembers
SoSH Member
Sep 14, 2002
8,467
Halifax, Nova Scotia , Canada
iayork said:
Well, that's my point, or at least my question. The minors don't have pitch f/x. Do they have "the old zone"? I assume they do, so rookies are being moved literally overnight from one strike zone to another that's much larger. By comparison, major leaguers have seen a gradual year-by-year change that they can consciously or unconsciously adapt to. Hence, more of a problem for rookies.
But there's a chicken - egg thing going on .. PitchFX is training umpires to call lower strikes .. and this new learned strikezone is filtering down (presumably) to the minors. Umps in the minors -especially the low minors have no exposure to Pitch-Fx - but surely must be influenced by the wider baseball environment. Perhaps someone with knowledge of modern Umpire schools could chime in with the types of resources they use? Do Ump schools use Pitch-Fx systems?

Which brings us to other great variable .. have offensive levels in the minors shown the same steady decline in the past few years?
 

iayork

Member
SoSH Member
Apr 6, 2006
639
BCsMightyJoeYoung said:
Which brings us to other great variable .. have offensive levels in the minors shown the same steady decline in the past few years?
Great question.  I don't know where to find detailed stats, but a pretty close estimate for minor-league OPS can be got by averaging team OPS, which are available on http://www.milb.com/milb/stats/stats.jsp?sid=milb&t=l_tba&lid=117 back to 2005.  The numbers jump around some, but there really doesn't seem to be the same trend as in MLB.  

Edit to add a more detailed comparison, from 1990 on. 
 

iayork

Member
SoSH Member
Apr 6, 2006
639
So I got the PitchFX data and looked for myself.  Short answer: It does look as if there's been a significant expansion in the strike zone in the past few years.  
 
I started with data just from Fenway Park, with the idea that it would reduce variables by only using one system (though of course, it could change year to year, so the logic isn't that solid).  I looked at called strikes, and at all pitches.  I'll show the results in a number of different ways, with the last one being probably the simplest and easiest to see differences in.  
 
Here are called strikes just from 2008 (left) and 2014 (right).  This shows differences, but there are easier ways to see them.
 
 
We're not interested for now in the horizontal dimension (which hasn't particularly changed over the years), so let's just compare vertical distribution of called strikes as well as all pitches thrown:
 
 
It's even easier to see the trends as a violinplot:
 
And the simplest and easiest is to show the probability of a pitch being called a strike, vs its vertical height (lots of pitches are never called strikes, of course, so this never reaches 100%, but the trend is obvious):
 
This is a really striking [1] difference, with a sharp and sudden change in the strike zone in 2012 followed by a lesser, but still significant, change in 2013.  There are places over the plate where an umpire was four times as likely to call a strike as in 2012 as in 2011.  That seems huge, especially for a team that's been encouraging its batters to take pitches and draw walks.  
 
But I worried that this might just be because Joe Bob in the back there bumped into the camera in 2012, and no one ever got around to fixing it.  So I did the same thing for a few other parks:


Turner Field was least affected of this group, and the others show more of a gradual shift than the abrupt year-to-year change that Fenway had.  But all of them, to some extent, show the strike zone expanding, mainly dropping down at the bottom, with a much smaller drop at the top of the zone.
 
Is this enough to explain the gradual reduction in offense over the same period?  I think it's enough to explain part of it, and maybe most of it, but I don't know what the net step in looking for a smoking gun would be.
 
 
1.  Har har.
 

crystalline

Member
SoSH Member
Oct 12, 2009
5,771
JP
Cool stuff.

One comment: I worry a little that you're introducing a bias by looking at called strikes as a percentage of all pitches. I can't see an obvious way the numbers would be affected, but perhaps this effect could be created if batters started to swing less at low pitches or foul them off more, resulting in more called strikes? Unlikely because you'd think it might happen throughout the zone, but there is still a little worry that batter behavior affects the enlarged strike zone. What happens if you look only at balls that were not put in play or swung on? (I think that is just balls+called strikes). Then your y axes on the last plots will go to 100%.
 

williams_482

Member
SoSH Member
Jul 1, 2011
391
iayork said:
Is this enough to explain the gradual reduction in offense over the same period?  I think it's enough to explain part of it, and maybe most of it, but I don't know what the net step in looking for a smoking gun would be.
Awesome post. I really love your visuals, and they do an awesome job showing how the strike zone has moved. 
 
It seems very likely that the shifting strike zone is the primary cause of the decline in offense. A look at the numbers for all non pitchers since 2008 (link) shows a fairly steady decline in walk rates (8.9% down to 7.8%, with a slight uptick to 9.1% in 2009) and a similar increase in strikeout rates (17.0% to 19.9%). BABiP has been fairly consistent, hovering between a high of .302 in 2008 and a low of .297 in 2011. ISO has also declined (.156 down to .138, with a peak of .159 in 2009), and it looks to me like a possible cause is an increase in ground balls (43.5% to 44.5% with a 2009 floor of 43.0%) and corresponding decline in fly balls (36.3% to 34.7%, with a 2009 peak of 38.1%). Home Run per fly ball and Infield fly per fly ball ratios show no clear pattern, so the issue may be more about volume than efficiency, and in fact wRC+ on fly balls has been rising inconsistently (103, 115, 118, 117, 125, 120, 115 from 2008 to 2014). Although I cannot back this up with statistics, this seems like a reasonable outcome from hitters getting more and more low pitches: fewer fly balls, but the ones they do get in the air are more likely to be crushed.
 

iayork

Member
SoSH Member
Apr 6, 2006
639
crystalline said:
One comment: I worry a little that you're introducing a bias by looking at called strikes as a percentage of all pitches.
 
I didn't explain that well.  I was only looking at balls and called strikes; the reason the strike percent only reaches about 70% is that I didn't slice horizontally, so there are still balls inside and outside. 
 
Here's what it looks like with a narrow slice right over the plate.  I also looked at 24 MLB venues (the ones with the same names in 2008 to 2014, which I know isn't exactly right -- Yankee stadium, for example -- but, whatever), and the 52 umpires who called the most pitches over this period.
 
Venues (larger, less fuzzy version at http://iayork.com/Images/2014/11-1-14/venues.png):
 
Umpires (larger version at http://iayork.com/Images/2014/11-1-14/umpires.png):
 
I don't see any gigantic trends here. Some parks seem to be much more affected than others (Fenway, Progressive, Safeco).  A few umpires haven't changed significantly over the years (Bill Welke, Tom Hallion), but almost all show a drop in the bottom of their strike zone, either in 2013 or 2014.  That's in contrast to the tops of their zones, which are mostly absolutely rock-solid.
 
I can't think of anything to explain this other than a real increase in the size of the zone.  
 

iayork

Member
SoSH Member
Apr 6, 2006
639
iayork said:
 
I don't see any gigantic trends here. Some parks seem to be much more affected than others (Fenway, Progressive, Safeco).  A few umpires haven't changed significantly over the years (Bill Welke, Tom Hallion), but almost all show a drop in the bottom of their strike zone, either in 2013 or 2014.  
 
Look at Jim Joyce, for a model of consistency -- even though he changed his lower zone in from 2010 to 2012, he was absolutely solid within each of his zones.  
 
Status
Not open for further replies.