I've been playing around with some of the statcast data and trying to figure out how well we can predict the success of a pitch from the tracking data alone. More broadly, the idea behind FIP was to recognize that pitchers do not control the defenses behind them, so that any attempt to measure pitcher skill should take the "luck" of whether their defense was successful out of the metric. However, there are other forms of luck as well. Sometimes a hanging breaking ball doesn't get punished. And sometimes an excellent pitch ends up over the fence.
So, the idea is to train models to predict what the typical outcome of a pitch should be. I've ended up taking an approach similar to pitching+, but with a few modifications because I wanted to arrive at the same idea independently. In particular, I feel strongly that the release point cannot be used in trained algorithms like this, because the release point ends up being too identifiable to a specific pitcher in many cases. Thus, you end up using the actual results of some of a pitcher's pitches to predict the others, which is a much different problem than using the results of similar ones. Or, to put it another way, pitches thrown with precisely deGrom's release point are really, really good, because many of those are thrown by deGrom, who is really, really good. But if you took another pitcher and adjusted their release point to match deGrom's, they wouldn't be expected to have similar success.
I thought it might be fun to put a thread together with some of the stuff I've been learning, as well as some of the things which I'm still trying to understand. Feel free to either move the thread or tell me to add it to existing threads someplace if there's a better fit.
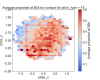
I thought I'd start out with something which I really didn't expect to find here and which goes against what I learned about pitching as a kid: the whole donut hole thing isn't actually quite right. What I thought I knew about pitching was that the couple of inches around the border of the strike zone belonged to the pitcher and everything else belonged to the hitter. That is, the value of a pitch might look something like this (produced from the model I've been working on):
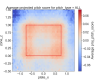
Here, the pitch score is approximately in runs saved compared with an average MLB pitch in 2023, and a positive score is good for the pitcher. This is from the catcher's point of view to a right-handed hitter, and zone_z the actual height of the pitch scaled to the hitter's strike zone. Something similar is shown in the Fangraphs version of pitching+; here is their equivalent location for a 3-2 sinker (they break this up by count and pitch type):
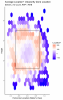
Very few actual MLB pitchers, including the excellent ones, actually make a donut hole like this. For example, here are the locations of all MLB pitches in 2023 vR along with Kevin Gausman and Aroldis Chapman (just a couple of examples):
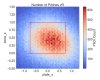
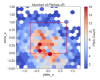
Chapman in particular just takes incredible stuff and tries to hit the zone with it. But even good MLB pitchers seem to be mostly capable only of hitting the zone, not also of consistently hitting the corners. The model still thinks he's an excellent pitcher, basically rating his stuff as being so valuable that even when he throws the ball down the middle, it's about an average MLB pitch in terms of expected result.
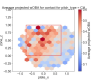
Anyway, a donut hole appears to be the goal when we assume, like FIP does, that the pitcher has no control over balls in play. It's still important to miss the center of the zone, because balls that are throw middle-middle tend to end up disproportionately over the fence. But if we look at what happens based on the tracking after a ball is put in play, something different pops up:
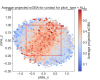
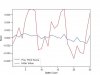
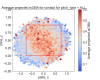
At first I was a bit puzzled by this, but in retrospect it actually seems obvious what is happening. The barrel of the bat is a fixed distance from the hitter's shoulders, so when a MLB hitter makes contact, the distance from the shoulders is essential. There's a velocity dependence as well, because of how quickly a hitter can turn on a pitch. For example, this is the same thing for fastballs and for changeups:
But the idea is the same. And if we look at the same thing for lefties, of course, it's just a mirror image:
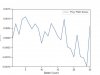
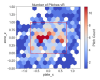
And I think realizing this also helps to explain why a pitcher like Blake Snell is so effective. Here's his pitch map vR in 2023:
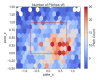
When I tried to project his success using the donut hole idea, it thought Snell was around the 50th best SP in MLB in 2023 on expected results. Including the effect of command on pBABIP, Snell ends up 8th. So whether you want to sign Snell is also something of a test of whether you treat pBABIP as a skill or purely as luck. This same metric also really likes Pivetta, by the way.
Anyway, I'd love to get some feedback on things I could try with this model, both in terms of improving it and also what might be useful questions to ask. This post is a big long as is, so one that I'll leave to a future post is that I found the first 10 or so pitches of a SP's outing are potentially predictive of the rest of the outing in terms of pitch quality. So, I wonder whether teams could use real-time tracking data to occasionally decide that a pitcher just doesn't have his best stuff that day, turn the outing into a side session, and bring him back in a few days.
Oh, and the Devers HR above is one of the best pitches by this metric to have been hit for a HR in 2023. And here is the pitch with the highest pitch score (since the count is included in predicted runs gained/lost, it's really the nastiest 3-2 pitch).
So, the idea is to train models to predict what the typical outcome of a pitch should be. I've ended up taking an approach similar to pitching+, but with a few modifications because I wanted to arrive at the same idea independently. In particular, I feel strongly that the release point cannot be used in trained algorithms like this, because the release point ends up being too identifiable to a specific pitcher in many cases. Thus, you end up using the actual results of some of a pitcher's pitches to predict the others, which is a much different problem than using the results of similar ones. Or, to put it another way, pitches thrown with precisely deGrom's release point are really, really good, because many of those are thrown by deGrom, who is really, really good. But if you took another pitcher and adjusted their release point to match deGrom's, they wouldn't be expected to have similar success.
I thought it might be fun to put a thread together with some of the stuff I've been learning, as well as some of the things which I'm still trying to understand. Feel free to either move the thread or tell me to add it to existing threads someplace if there's a better fit.
I thought I'd start out with something which I really didn't expect to find here and which goes against what I learned about pitching as a kid: the whole donut hole thing isn't actually quite right. What I thought I knew about pitching was that the couple of inches around the border of the strike zone belonged to the pitcher and everything else belonged to the hitter. That is, the value of a pitch might look something like this (produced from the model I've been working on):
Here, the pitch score is approximately in runs saved compared with an average MLB pitch in 2023, and a positive score is good for the pitcher. This is from the catcher's point of view to a right-handed hitter, and zone_z the actual height of the pitch scaled to the hitter's strike zone. Something similar is shown in the Fangraphs version of pitching+; here is their equivalent location for a 3-2 sinker (they break this up by count and pitch type):
Very few actual MLB pitchers, including the excellent ones, actually make a donut hole like this. For example, here are the locations of all MLB pitches in 2023 vR along with Kevin Gausman and Aroldis Chapman (just a couple of examples):
Chapman in particular just takes incredible stuff and tries to hit the zone with it. But even good MLB pitchers seem to be mostly capable only of hitting the zone, not also of consistently hitting the corners. The model still thinks he's an excellent pitcher, basically rating his stuff as being so valuable that even when he throws the ball down the middle, it's about an average MLB pitch in terms of expected result.
Anyway, a donut hole appears to be the goal when we assume, like FIP does, that the pitcher has no control over balls in play. It's still important to miss the center of the zone, because balls that are throw middle-middle tend to end up disproportionately over the fence. But if we look at what happens based on the tracking after a ball is put in play, something different pops up:
At first I was a bit puzzled by this, but in retrospect it actually seems obvious what is happening. The barrel of the bat is a fixed distance from the hitter's shoulders, so when a MLB hitter makes contact, the distance from the shoulders is essential. There's a velocity dependence as well, because of how quickly a hitter can turn on a pitch. For example, this is the same thing for fastballs and for changeups:
But the idea is the same. And if we look at the same thing for lefties, of course, it's just a mirror image:
And I think realizing this also helps to explain why a pitcher like Blake Snell is so effective. Here's his pitch map vR in 2023:
When I tried to project his success using the donut hole idea, it thought Snell was around the 50th best SP in MLB in 2023 on expected results. Including the effect of command on pBABIP, Snell ends up 8th. So whether you want to sign Snell is also something of a test of whether you treat pBABIP as a skill or purely as luck. This same metric also really likes Pivetta, by the way.
Anyway, I'd love to get some feedback on things I could try with this model, both in terms of improving it and also what might be useful questions to ask. This post is a big long as is, so one that I'll leave to a future post is that I found the first 10 or so pitches of a SP's outing are potentially predictive of the rest of the outing in terms of pitch quality. So, I wonder whether teams could use real-time tracking data to occasionally decide that a pitcher just doesn't have his best stuff that day, turn the outing into a side session, and bring him back in a few days.
Oh, and the Devers HR above is one of the best pitches by this metric to have been hit for a HR in 2023. And here is the pitch with the highest pitch score (since the count is included in predicted runs gained/lost, it's really the nastiest 3-2 pitch).