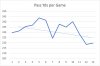
Yes, but when I look at it I am analyzing it as someone who is just alot smarter than you guys. It’s kind of canon at this point. If you don’t believe me, go through the draft threads for the last 5 seasons and see how excited you all were about this shit salad. There are many other proof pointa but that is the simplest. Your post is next.Interesting you keep falling back to a lack of intelligence when it’s really just perspective. QBR is down 5 points since 2020. You literally keep saying there was a spike and now it’s less. We’re saying the same damn thing. The play is lesser than previous years is it not? A spike infers a rise? Then it goes down yeah? Just because you’re not catastrophizing it doesn’t make it any less true.
Asking for clarity, do you honestly think the overall game is the same this year or are you looking to data points to talk yourself into it? Like if it’s not QB play, what is it? Refs taking over the game interrupting flow? Injuries? It can’t just be because the Pats suck… can it?
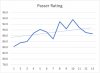
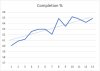
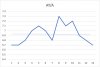
When you analyze data over time you look for Trend, Seasonality, Cycle and the irregular (random).
The spike in 2020 was not driven by quality of play or a new trend of brilliance. A reasonable, rational person can assess 2020 as inherently an outlier. It was a pandemic, reduced/no crowds, all kinds of changes to the game prep, no preseason, etc. And consequently you get a larger than normal variance off of the TSCi, an enhanced “random variance” driven by factors not common to the game’s play.
And man do idiots love extreme data points in line graphs (they do worse with data in pie charts, but let’s table that for now).
There is no new downward trend if you know how to analyse data. The last 10 years have been quite consistent for this metric and the current variance from the 90.0 is well within the 1.5 bracket of irregular noise (weather driven, injury driven, etc) established in the data. Plus, there is still another half of football to be played and QBs in aggregate tend to improve as the season goes on.
Tomorrow when you wake up thinking of things to be grateful for, you can be grateful for me. I save you fools from your own football ignorance constantly. You are blinded by ignorance and a deep fealty to a man who has always been a good coach and mediocre GM, but I forgive you.
You are welcome you collective group of boneheads.